Dashboard & Analytics
Your mission, your impact — all in one powerful view.
The Dashboard & Analytics section provides a centralized overview of your organization's performance, combining financial data, donor insights, campaign progress, and operational activity into one intuitive interface. It helps users quickly understand trends, monitor key metrics, and make data-driven decisions.
- View high-level metrics: total donations, net income, expenses, and active users
- Track donation trends over time with visual charts and graphs
- Analyze donor distribution by type — individual, corporate, government, foundation
- Monitor active campaigns and funding progress in real time
- Access recent activity and communications for better engagement tracking
- Review pending grant applications and funding opportunities
Turn Data into Actionable Insights
A centralized dashboard that brings together every metric your team needs — so decisions are faster, better-informed, and backed by real data.
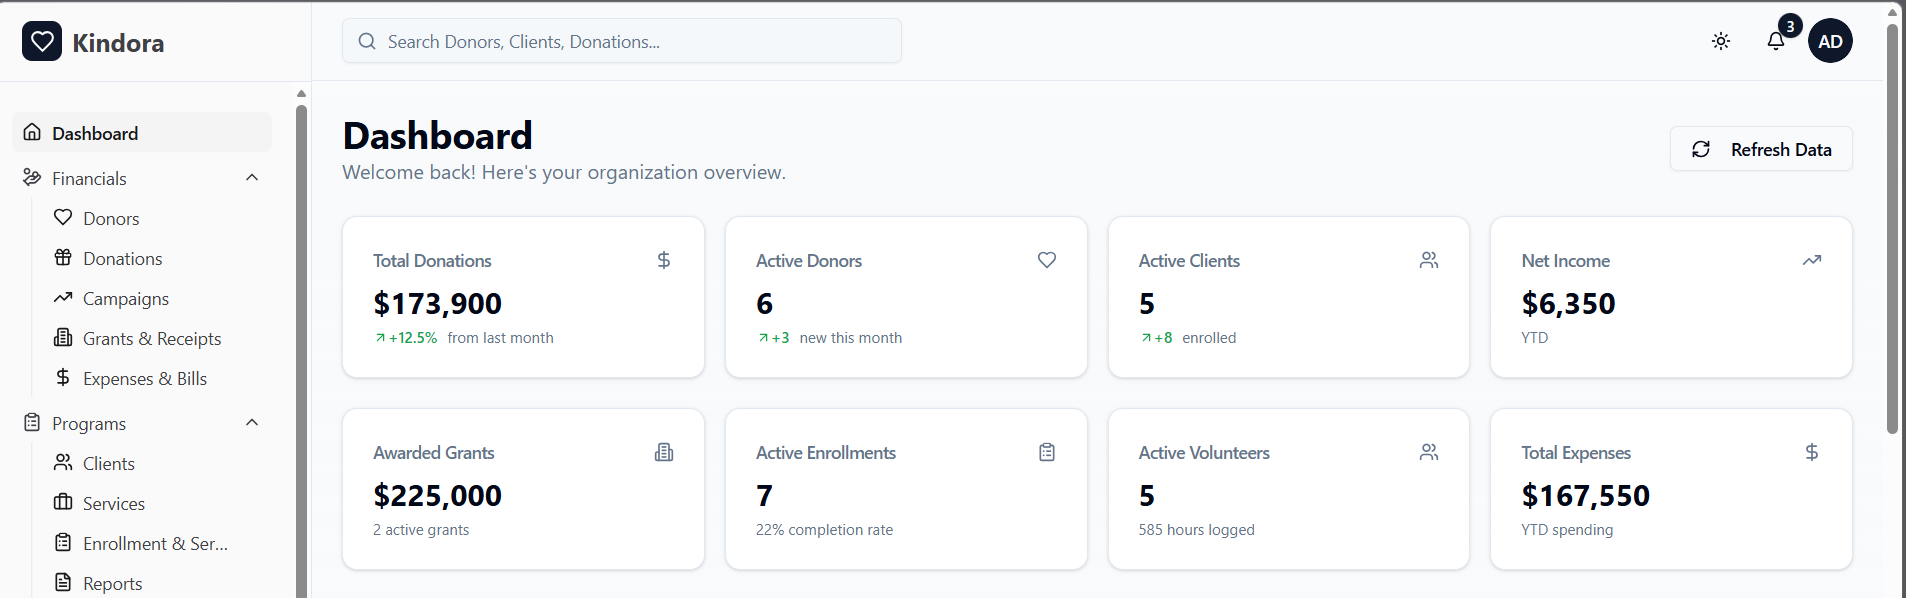
High-Level Metrics Overview
View key metrics at a glance — total donations, net income, expenses, and active users. Understand your organization's financial health and operational activity without digging through reports.
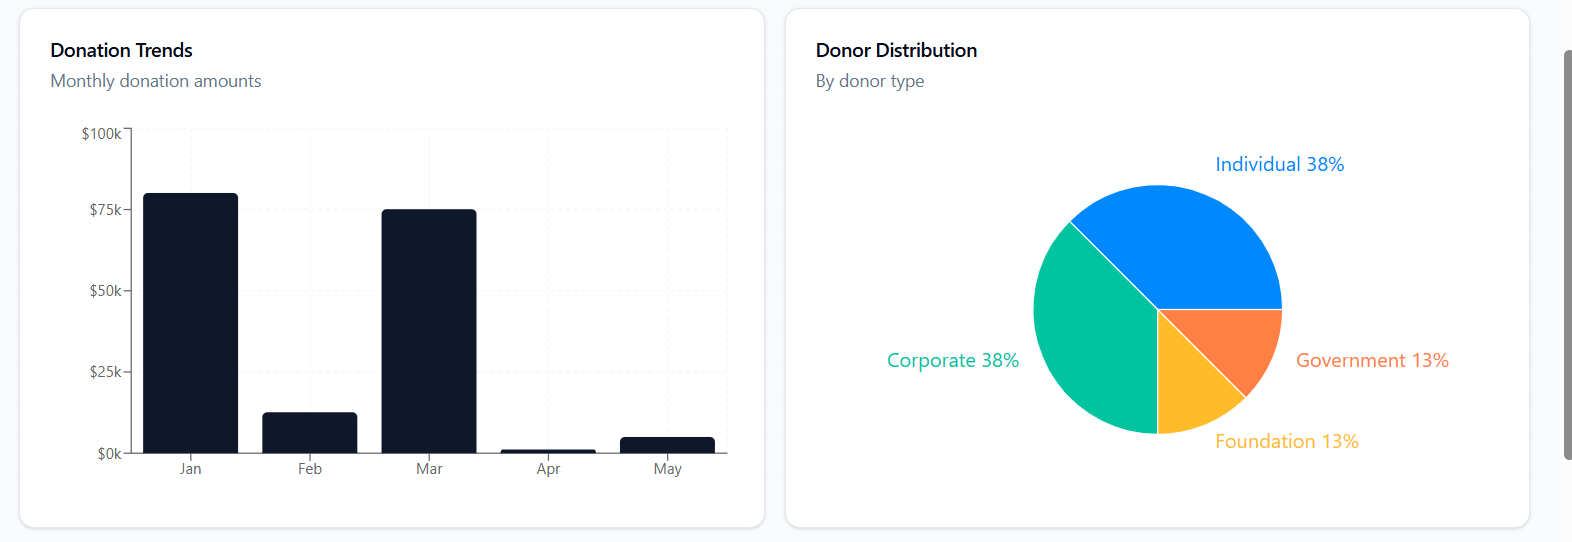
Donation Trend Charts
Track donation patterns over time with visual charts and graphs. Identify peak giving periods, seasonal patterns, and growth trends to optimize your fundraising calendar.
Donor Distribution Analysis
Analyze your donor base by type — individual, corporate, government, and foundation. Understand your funding mix and identify opportunities to diversify revenue sources.
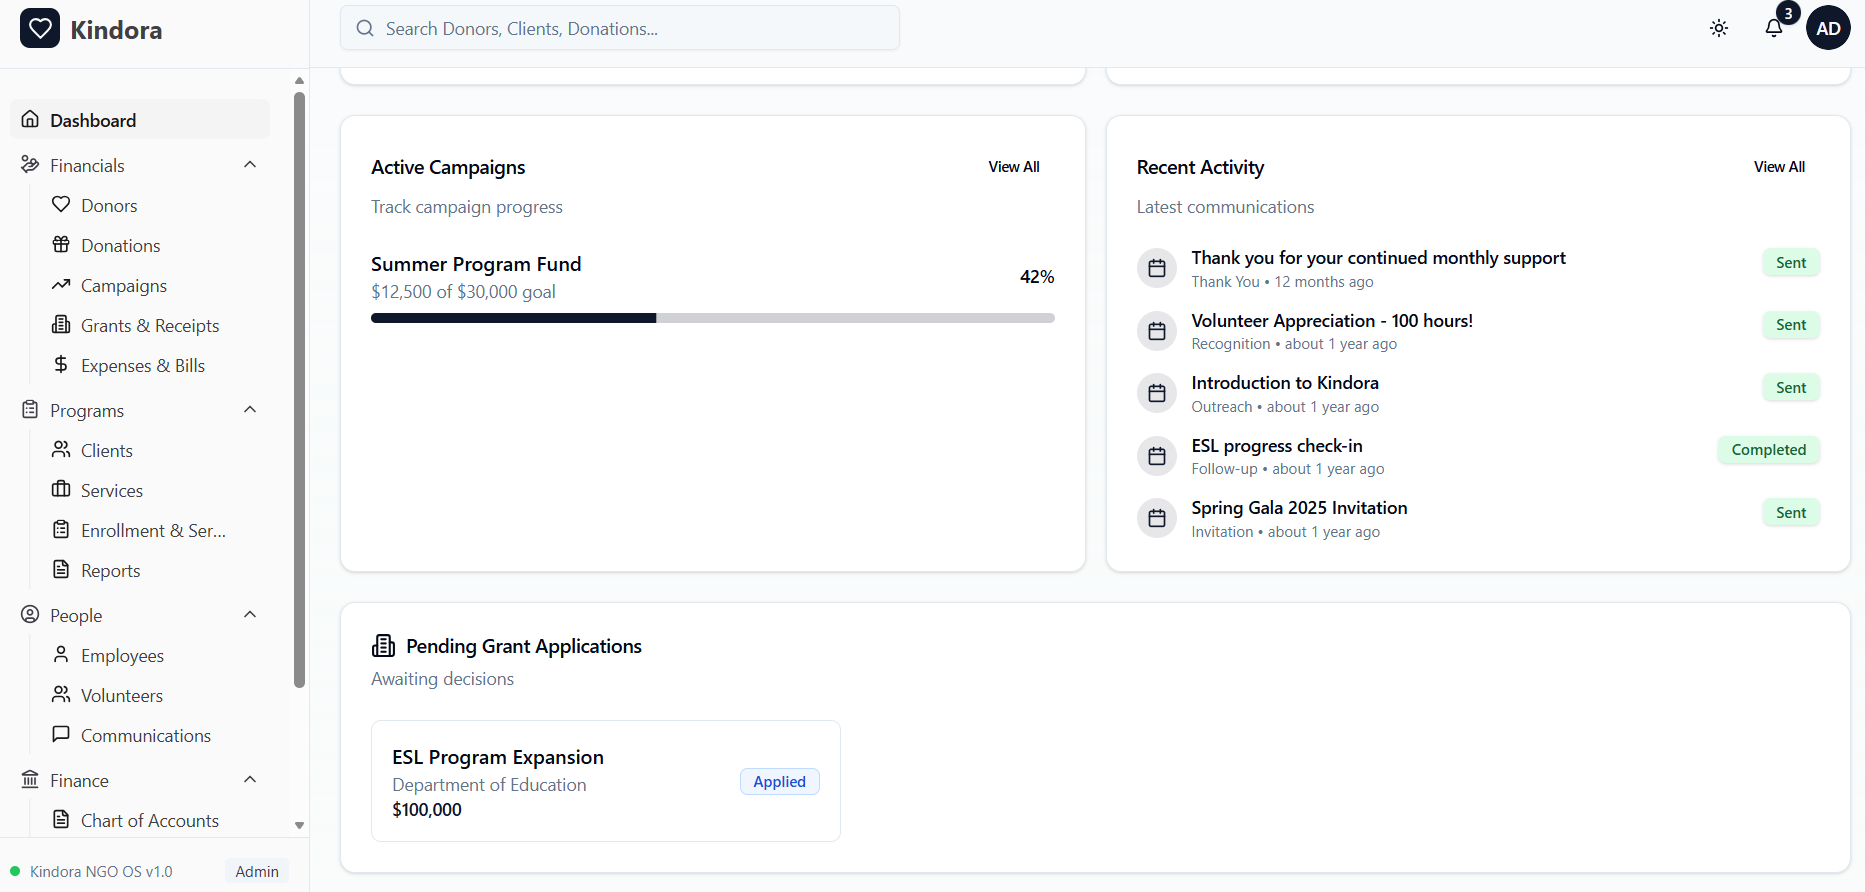
Campaign Progress Monitoring
Monitor active campaigns and funding progress in real time. See goal-versus-raised progress for every campaign and take action before any fall behind.
Recent Activity & Communications
Access a live feed of recent activity and communications for better engagement tracking. Stay informed of new donations, grant updates, client enrollments, and team actions.
Grant Applications Overview
Review pending grant applications and upcoming funding opportunities directly from the dashboard. Never miss a deadline or lose track of an active grant application.
More Dashboard Views
Explore different sections of the Kindora dashboard — from donation trends to campaign progress.
Donor Trends & Distribution
Campaign Progress & Activity Feed
See Your Impact in Real Time
Schedule a demo and see how Kindora's dashboard brings together all your nonprofit's data — donations, campaigns, grants, and programs — in one place.